Edges
Edges are the arrows connecting your boxes. They show how data moves from one node to another like pipes carrying water.
What is an Edge?
Section titled “What is an Edge?”An edge is just a connection:
- Start: From a dot on the right side of a node (output)
- End: To a dot on the left side of another node (input)
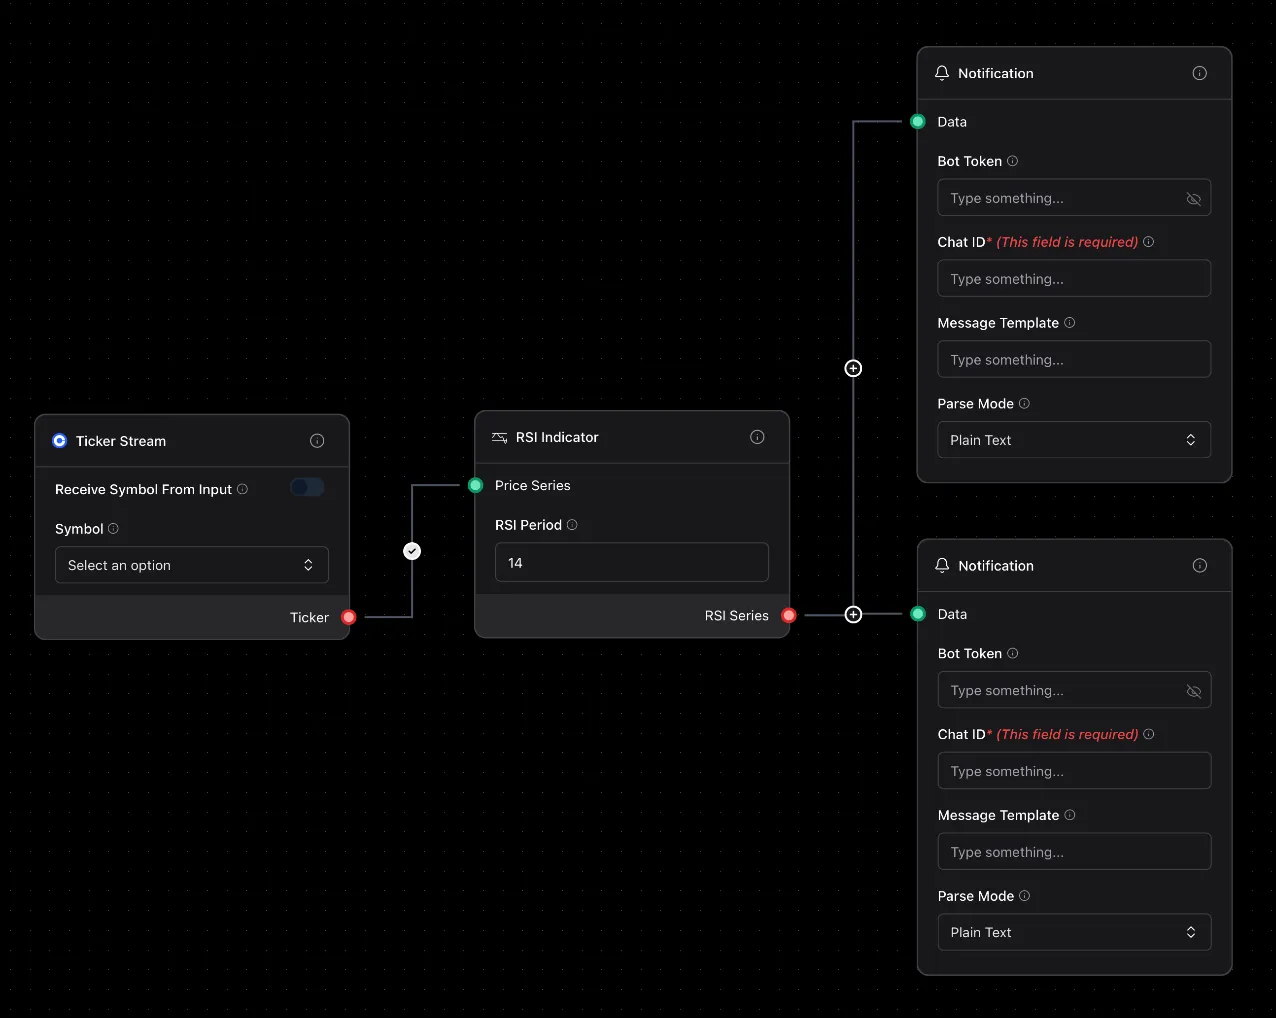
When Market Ticker outputs a price, the arrow carries that number to RSI Indicator.
How to Create an Edge
Section titled “How to Create an Edge”- Click a dot on the right side of a node
- Drag to a dot on the left side of another node
- Release — done!
The system won’t let you connect incompatible types. If it won’t connect, the data types don’t match.
What’s Flowing Through?
Section titled “What’s Flowing Through?”Edges carry different types of data:
- Numbers:
150.75(stock price) - Text:
"AAPL"(asset symbol) - True/False:
true(price > 150?) - Objects: Complex data like full ticker info
Edge Status
Section titled “Edge Status”
Look at the arrow:
- Animated dots: Data flowing RIGHT NOW!
- Solid line: Connected, but idle
- Red line: Error! Something’s wrong
Managing Edges
Section titled “Managing Edges”- Delete: Click the edge, press Delete
- Reconnect: Click the arrow, drag the end to a different dot
- See data: Click the edge to see what’s flowing (current value)
- Configure: Click the circle on the edge to open the configuration dialog
Edge Configuration
Section titled “Edge Configuration”Click the circle button on any edge to configure Filter and Transform options.

Filter
Section titled “Filter”Filter expressions control which data passes through the edge. Only data that evaluates to true will continue.
Examples:
data > 100— Only pass values greater than 100data.price > 150— Only pass when price field exceeds 150data == "BUY"— Only pass when value equals “BUY”
Filter Options
Section titled “Filter Options”Advanced filter options give you more control over when data is sent:
Send Once Per Trigger
Section titled “Send Once Per Trigger”When enabled, data is only sent the first time the filter becomes true. The edge will not send again until the filter becomes false, then true again.
Use case: Alert me when RSI crosses above 70, but don’t spam me while it stays above 70.
How it works:
- Filter becomes
true→ Data passes through ✓ - Filter stays
true→ Data is blocked ✗ - Filter becomes
false→ State resets - Filter becomes
trueagain → Data passes through ✓
Auto-Reset After (seconds)
Section titled “Auto-Reset After (seconds)”When “Send Once Per Trigger” is enabled, you can optionally set a time-based reset. After the specified seconds, the “sent” state resets automatically, even if the filter hasn’t become false.
Use case: Send a notification when price drops below $100, but allow another notification after 60 seconds even if price stays low.
Example: Set to 60 to allow sending again after 1 minute.
Transform
Section titled “Transform”Transform expressions modify data before it reaches the next node. Useful for type conversion or data extraction.
Examples:
data * 2— Double the valuedata.close— Extract just the close price from a ticker objectstring(data)— Convert number to text
Common Patterns
Section titled “Common Patterns”One to Many (Fan-Out)
Section titled “One to Many (Fan-Out)”One Market Ticker → Three RSI Indicators (different periods)
Same price data goes to multiple nodes. Perfect for testing different strategies!
Many to One (Fan-In)
Section titled “Many to One (Fan-In)”Three Market Tickers (AAPL, GOOGL, TSLA) → One Synchronizer → One Telegram
Wait for ALL three prices, then send one alert.
Chain (Pipeline)
Section titled “Chain (Pipeline)”Market Ticker → RSI → AND Condition → Market Order
Data flows left to right through each step.
If/Else (Conditional)
Section titled “If/Else (Conditional)”AND Condition has two outputs: true and false
Connect true to Market Order (execute!)
Connect false to Telegram (just alert me)
Troubleshooting
Section titled “Troubleshooting”Q: Why won’t my edge connect?
A: Data types don’t match. Check: is the output a number but the input expects text?
Q: My edge is red!
A: Click it to see the error. Usually means data stopped flowing or wrong type was sent.
Q: Can I see what’s flowing through an edge?
A: Yes! Click the edge to see the current value. Or add a Printer node to log everything.
Q: Can one output connect to multiple inputs?
A: Absolutely! One Market Ticker can feed five different indicators.
Keep It Visual
Section titled “Keep It Visual”Arrange nodes so arrows flow left-to-right. Makes it easy to follow the logic!
Don’t Create Loops
Section titled “Don’t Create Loops”Avoiding connecting output back to earlier inputs—it can create infinite loops and crash your flow.
Use Printer for Debugging
Section titled “Use Printer for Debugging”Not sure what data looks like? Insert a Printer node anywhere to see everything flowing through.