Flows
Think of a flow as a recipe for your automation strategy. Just like a recipe has steps that happen in order, a flow shows how data moves through your system—from monitoring data sources, to making decisions, to taking actions.
What is a Flow?
Section titled “What is a Flow?”A flow is your automation visualized. Instead of writing code, you connect building blocks together:
- Boxes (Nodes): Each box does one job—like “get price data” or “send notification”
- Arrows (Edges): Show how data moves from one box to another
- Settings: Each box has dials you can adjust, like which asset to monitor
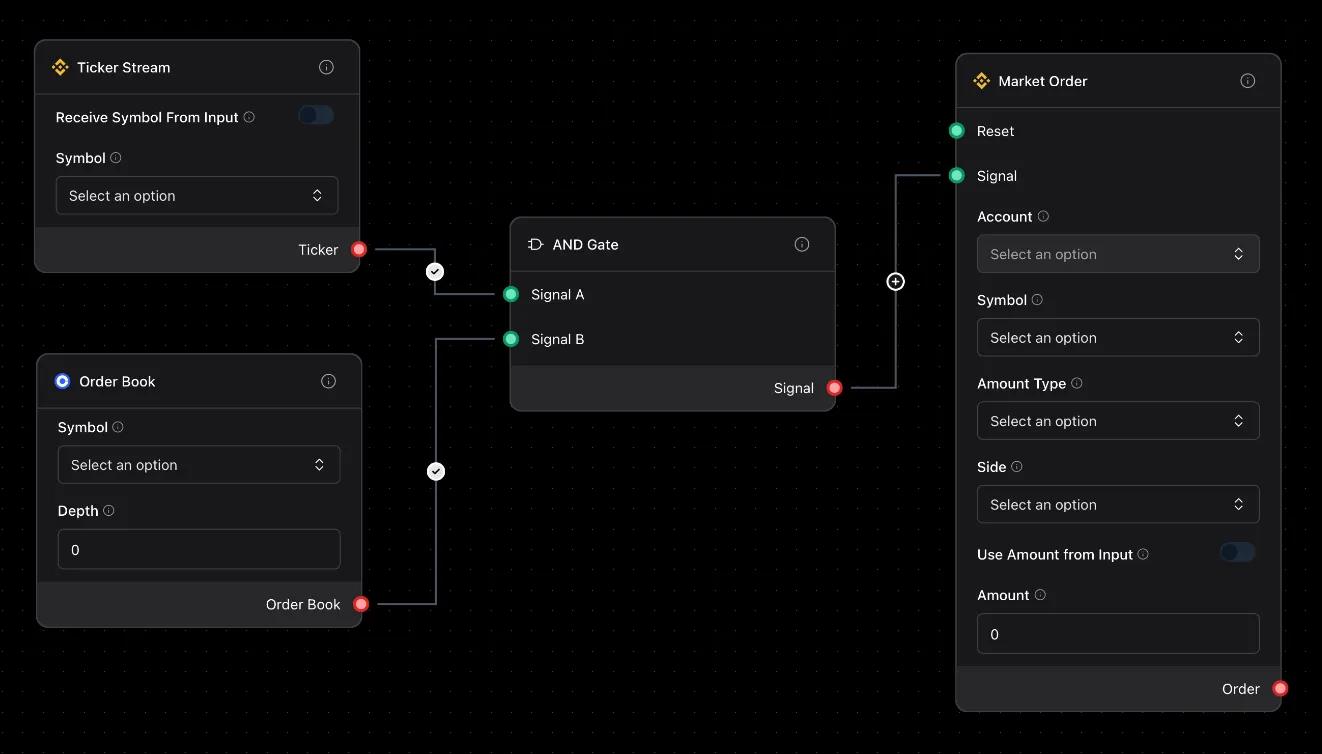
Real Example: A simple price alert flow connects three boxes: Market Ticker → AND Condition → Telegram Notification. When an asset hits your target price, you get a message
How to Build a Flow
Section titled “How to Build a Flow”Step 1: Drag and Drop
Section titled “Step 1: Drag and Drop”Drag boxes from the left panel onto your canvas. For example, drag a Market Ticker box to watch asset prices.
Step 2: Connect Them
Section titled “Step 2: Connect Them”Click and drag from one box to another to create arrows. This tells your system where to send data.
Step 3: Configure
Section titled “Step 3: Configure”Click any box to open its settings. For Market Ticker, you’d pick which asset (like AAPL, GOOGL) and how often to check the price.
Step 4: Run
Section titled “Step 4: Run”Hit the Run button! Your flow will:
- Start up all the boxes
- Begin moving data through the arrows
- Keep running until you stop it or something goes wrong
Types of Flows You Can Build
Section titled “Types of Flows You Can Build”Always-On Automation (Continuous)
Section titled “Always-On Automation (Continuous)”These run 24/7, constantly monitoring data:
Example: Market Ticker → RSI Indicator → AND Condition → Market Order
This flow monitors an asset, calculates RSI, and takes action when RSI drops below 30 (oversold).
Scheduled Automation
Section titled “Scheduled Automation”These run at specific times, like every day at 9am:
Example: Ping (Timer) → Market Bars → SMA Indicator → Telegram Notification
Every morning, this checks if an asset crossed above its 50-day moving average and sends you a report.
Alert System (Event-Driven)
Section titled “Alert System (Event-Driven)”These sit quietly until something specific happens:
Example: Market Ticker → AND Condition → Telegram Notification
Sits idle until price hits your target, then immediately sends an alert.
Flow Status
Section titled “Flow Status”Your flow can be in different states—just like a traffic light:
- 🟡 Draft: You’re still building it
- 🟢 Ready: All connected, ready to start
- 🔵 Running: Active and working right now
- 🟠 Paused: Temporarily stopped, can resume
- ⚫ Stopped: Finished and turned off
- 🔴 Failed: Hit an error and needs fixing
Running Your Flow
Section titled “Running Your Flow”Start It Up
Section titled “Start It Up”Three ways to start:
- Click “Run”: Start it right now
- Schedule It: Run every day at 9am, every hour, etc.
- Remote Start: Trigger it from another app or website
Stop It
Section titled “Stop It”Your flow stops when:
- You click “Stop”: Manual shutdown
- It finishes: Some flows have an end point
- Error happens: Something went wrong
Pause It
Section titled “Pause It”Hit pause to freeze everything temporarily. Hit resume to continue exactly where you left off—no data lost!
Watching Your Flow Work
Section titled “Watching Your Flow Work”When your flow is running, you can see:
- Green boxes: Working perfectly
- Red boxes: Hit an error
- Gray boxes: Idle, waiting for data
- Animated arrows: Data flowing right now
- Logs: Detailed history of what happened
Tips for Building Better Flows
Section titled “Tips for Building Better Flows”Start Simple
Section titled “Start Simple”Don’t build your entire strategy at once. Start with Market Ticker → Printer to make sure you’re getting data. Then add more boxes one at a time.
Name Things Clearly
Section titled “Name Things Clearly”Instead of “Node 1”, call it “Price Monitor” or “Alert When High”. You’ll thank yourself later!
Test Each Step
Section titled “Test Each Step”Add a Printer box after each step to see what data looks like. It’s like checking your recipe as you cook.
Handle Problems
Section titled “Handle Problems”What if the data source is down? What if an action fails? Add OR Condition boxes to handle “if this fails, do that instead.”
Power User Features
Section titled “Power User Features”Multiple Inputs
Section titled “Multiple Inputs”Use Synchronizer to combine data from multiple sources. Example: only act when multiple conditions are met.
Conditional Paths
Section titled “Conditional Paths”Use AND Condition to create “if price > threshold, act. Otherwise, wait” logic.
Parallel Processing
Section titled “Parallel Processing”Monitor multiple assets at once—each gets its own box, all running together.
Pattern Detection
Section titled “Pattern Detection”Use candlestick pattern detectors like Doji, Hammer, or Engulfing to spot trading opportunities automatically.