Nodes
A node is simply a component you’ve added to your canvas. Think of it like this: RSI Indicator is a component (the template), but the actual RSI box on your canvas is a node.
Node vs Component (Cookie Cutter vs Cookie)
Section titled “Node vs Component (Cookie Cutter vs Cookie)”- Component: Like a cookie cutter—the template for
Market Ticker - Node: The actual box on your canvas monitoring AAPL price
You can use Market Ticker three times in one flow—each box is a separate node:
- Node 1: Watches AAPL
- Node 2: Watches GOOGL
- Node 3: Watches TSLA
Same component, three different nodes with different settings!
What’s Inside a Node?
Section titled “What’s Inside a Node?”Every box on your canvas has:
- Settings: Click it to see—like “AAPL” for Market Ticker
- Name: “AAPL Price Monitor” (you can rename it!)
- Status: Color tells you if it’s working, idle, or broken
Node Status Colors
Section titled “Node Status Colors”Look at the border color:
- 🟢 Green: Working perfectly right now
- 🟡 Gray: Idle, waiting for data
- 🔵 Blue: Currently processing
- 🔴 Red: Error! Check the logs
- 🟠 Orange: Paused
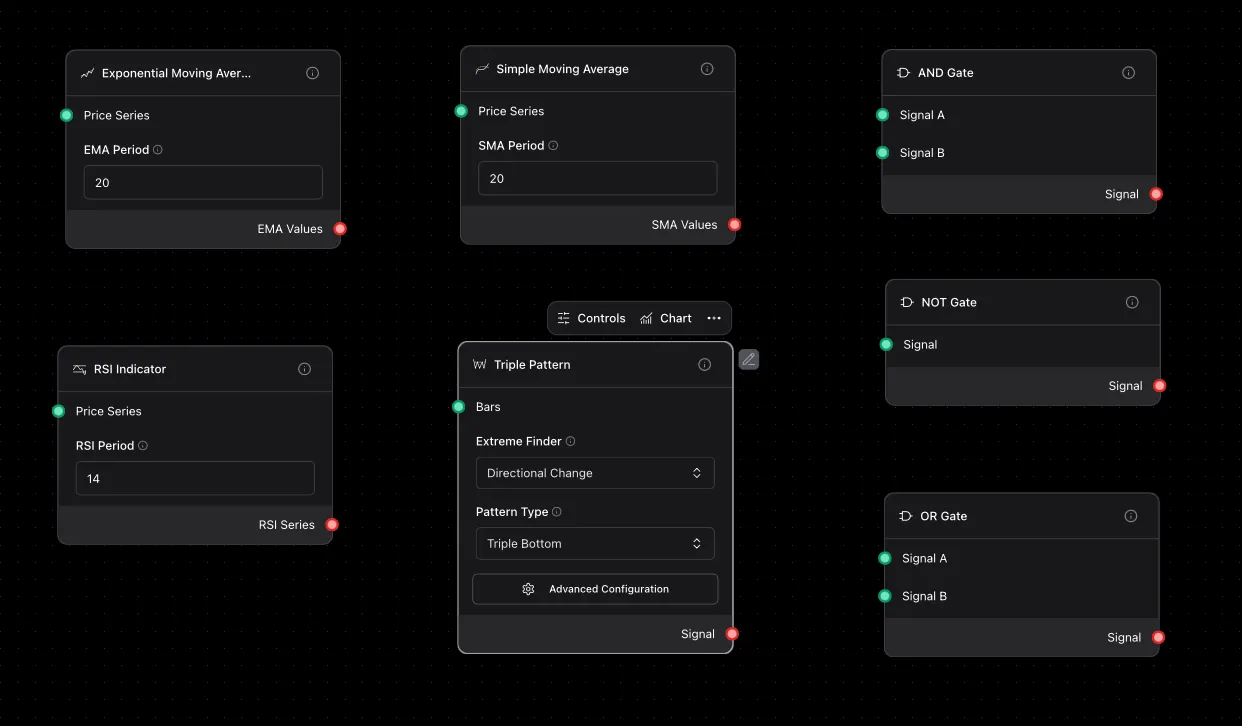
The Dots on Each Side
Section titled “The Dots on Each Side”Left Side (Inputs)
Section titled “Left Side (Inputs)”These dots receive data from other nodes.
RSI Indicatorhas one input: needs price dataAND Conditionhas one input: needs a value to check- Some nodes have NO inputs: like
Market Ticker(it gets data from exchanges, not from other nodes)
Right Side (Outputs)
Section titled “Right Side (Outputs)”These dots send data to other nodes.
Market Tickeroutputs: price, volume, high, lowRSI Indicatoroutputs: RSI value (0-100)- Connect one output to MANY inputs if you want!
Working with Nodes
Section titled “Working with Nodes”- Move it: Just drag anywhere
- Configure it: Click to open settings
- Delete it: Select and press Delete key
- Copy it: Cmd+C (Mac) or Ctrl+C (Windows), then Cmd+V/Ctrl+V to paste
- Rename it: Click the name at the top of settings
What Happens When You Run
Section titled “What Happens When You Run”- Startup: All nodes turn gray, checking if they’re configured correctly
- Running: Nodes turn green as data flows through
- Error: If something breaks, that node turns red—check the logs!
- Done: When you stop, all nodes return to gray
Debugging a Node
Section titled “Debugging a Node”Node turns red? Here’s what to do:
- Click it: See the error message
- Check settings: Missing a coin symbol? Wrong number?
- Check connections: Is data actually reaching it?
- Add a Printer: Put one BEFORE the broken node to see what data it’s getting
Pro Tips
Section titled “Pro Tips”Organize Your Canvas
Section titled “Organize Your Canvas”Drag nodes around! Put data sources on the left, decisions in the middle, actions on the right.
Name Your Nodes
Section titled “Name Your Nodes”Instead of “Market Ticker 1” call it “AAPL Price Monitor”. Future you will say thanks!
Test One Node at a Time
Section titled “Test One Node at a Time”Building a complex flow? Add one node, test it, add another, test again.
Common Questions
Section titled “Common Questions”Q: Can I use the same component multiple times?
A: Yes! Drag Market Ticker three times to watch AAPL, GOOGL, and TSLA simultaneously.
Q: What if I delete a node by accident?
A: Cmd+Z (Mac) or Ctrl+Z (Windows) to undo!
Q: Why won’t my nodes connect?
A: Probably wrong data type. You can’t connect a text output to a number input.
Q: How do I see what data a node is processing?
A: Add a Printer node after it. Shows everything in real-time!