Quick Start
Quick Start
Section titled “Quick Start”Get up and running with GrailHub in just a few minutes. This guide will walk you through creating your first automated trading flow.
Prerequisites
Section titled “Prerequisites”Make sure you have installed GrailHub Desktop before starting.
Step 1: Create Your First Flow
Section titled “Step 1: Create Your First Flow”When you first launch GrailHub, you’ll see a welcome screen.
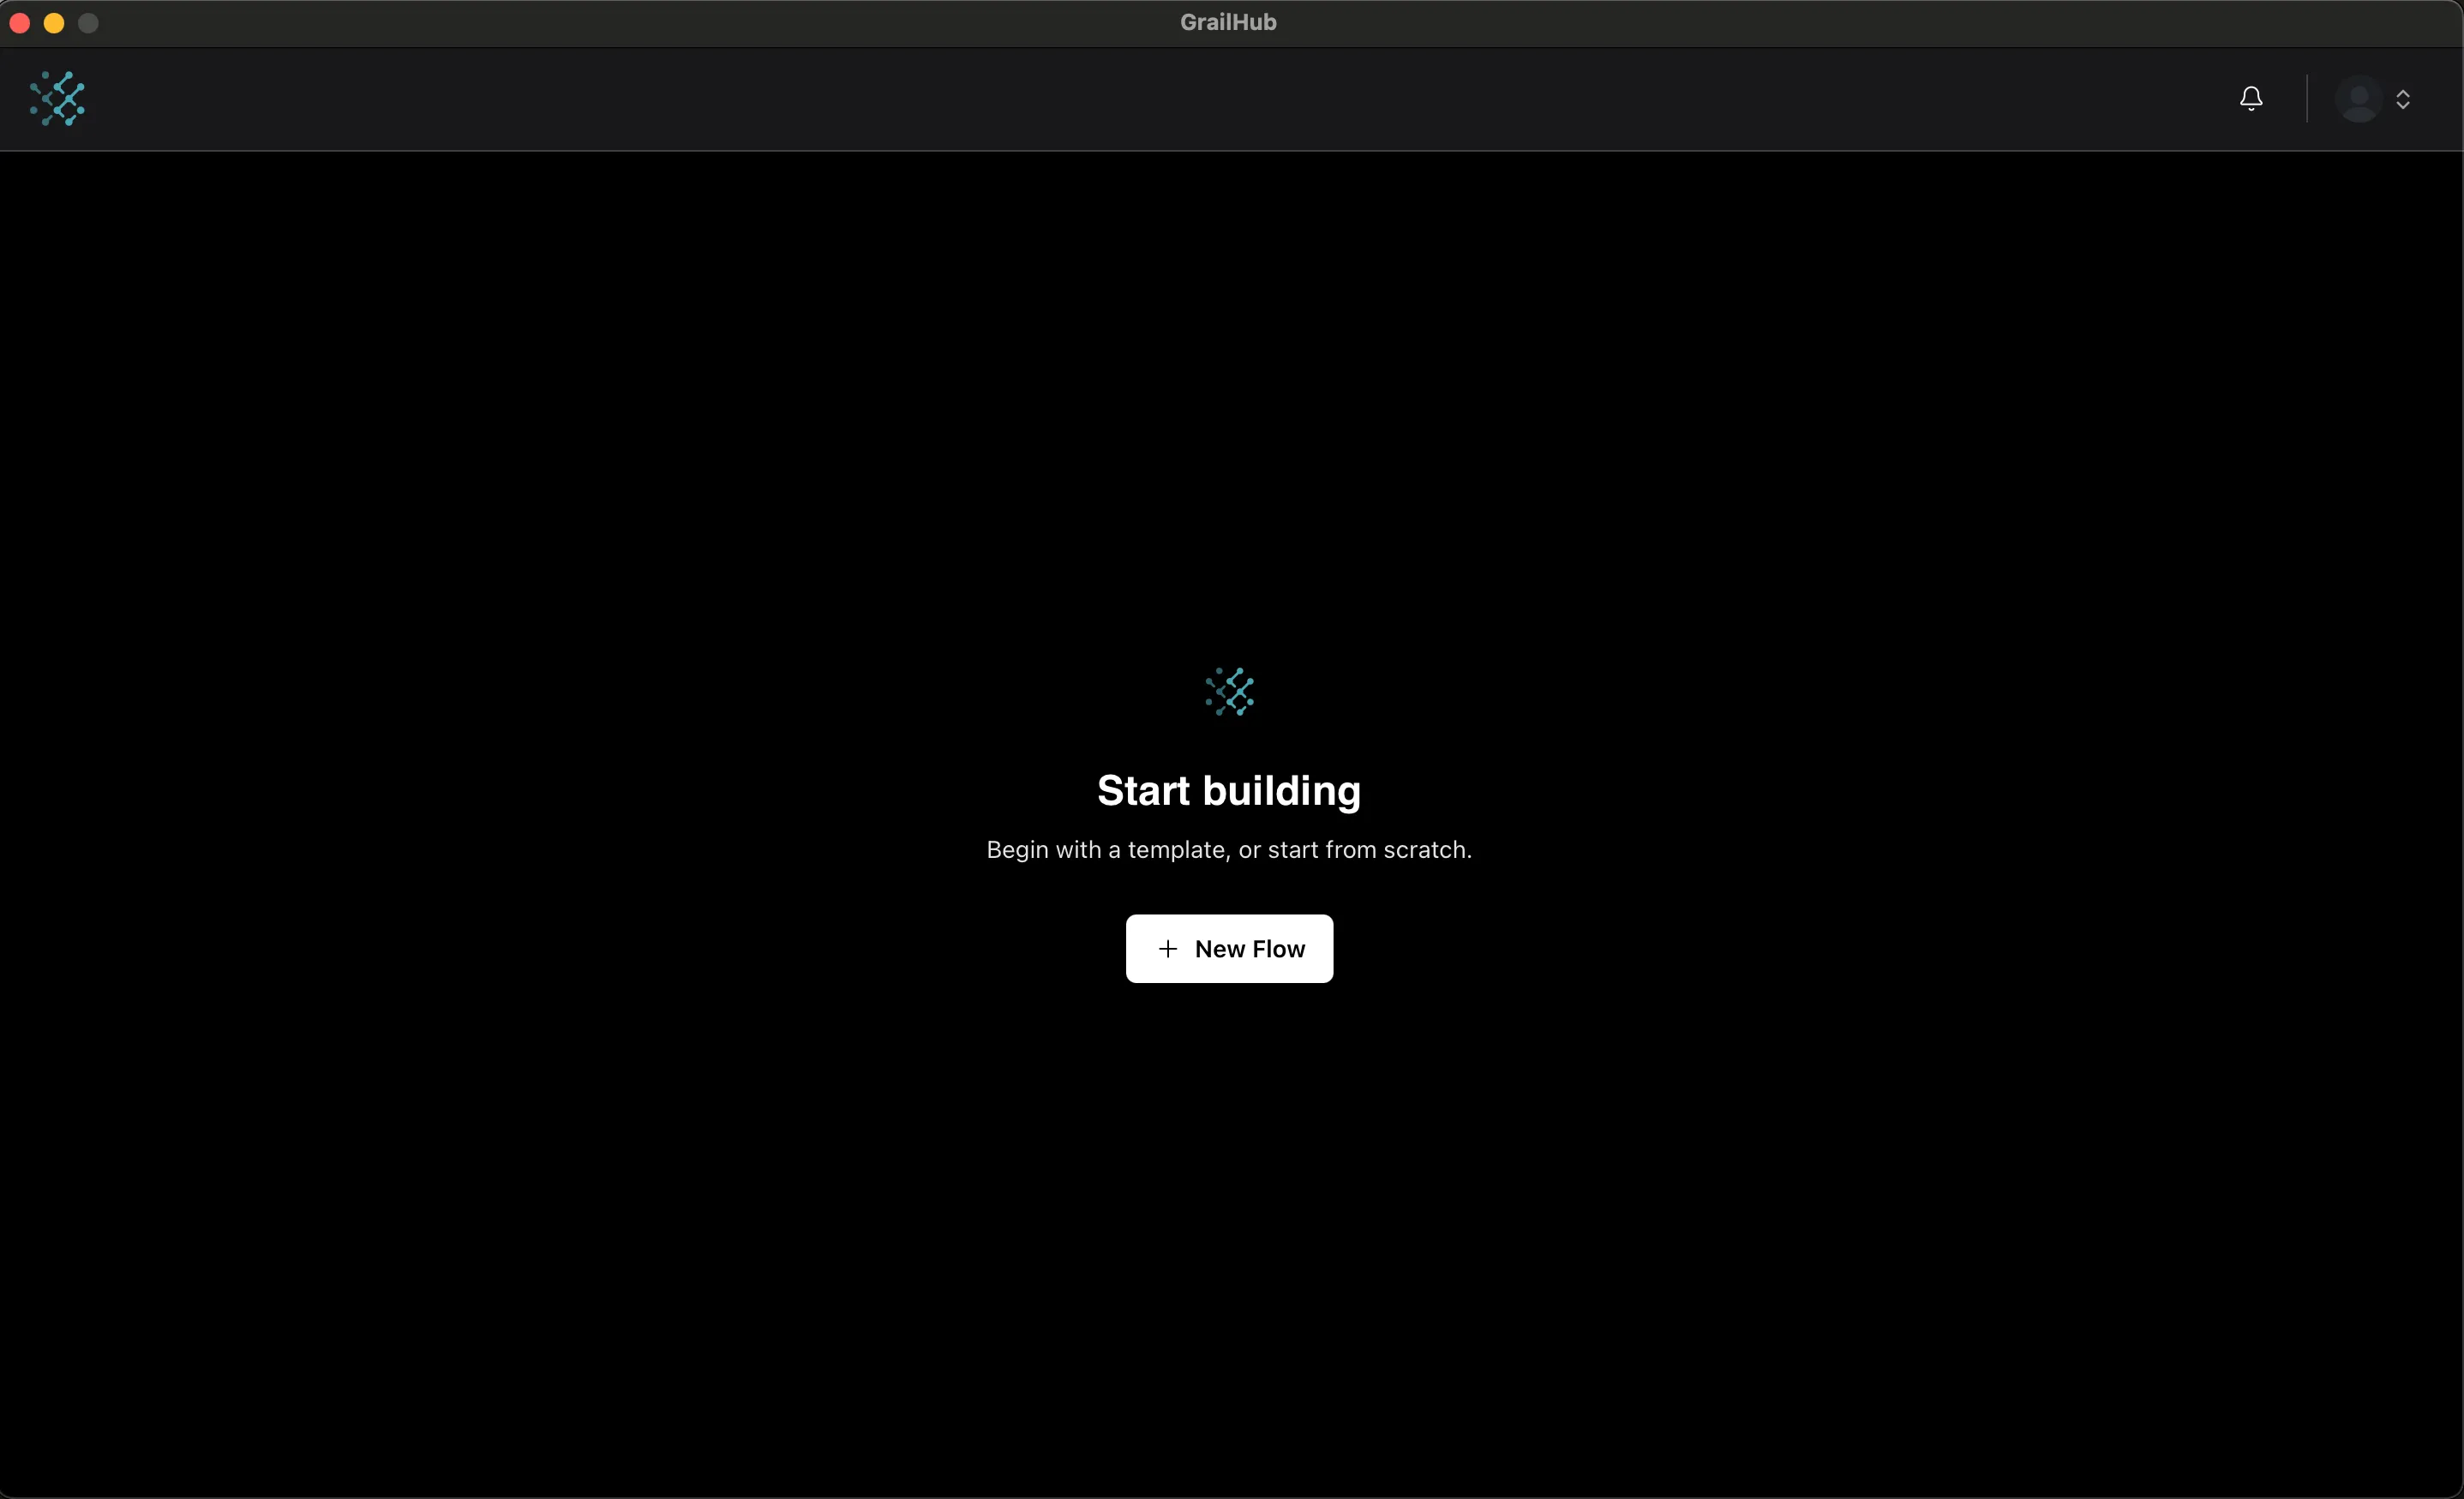
- Launch GrailHub Desktop.
- Click “New Flow” on the welcome screen.
- Choose “Blank Flow” template.
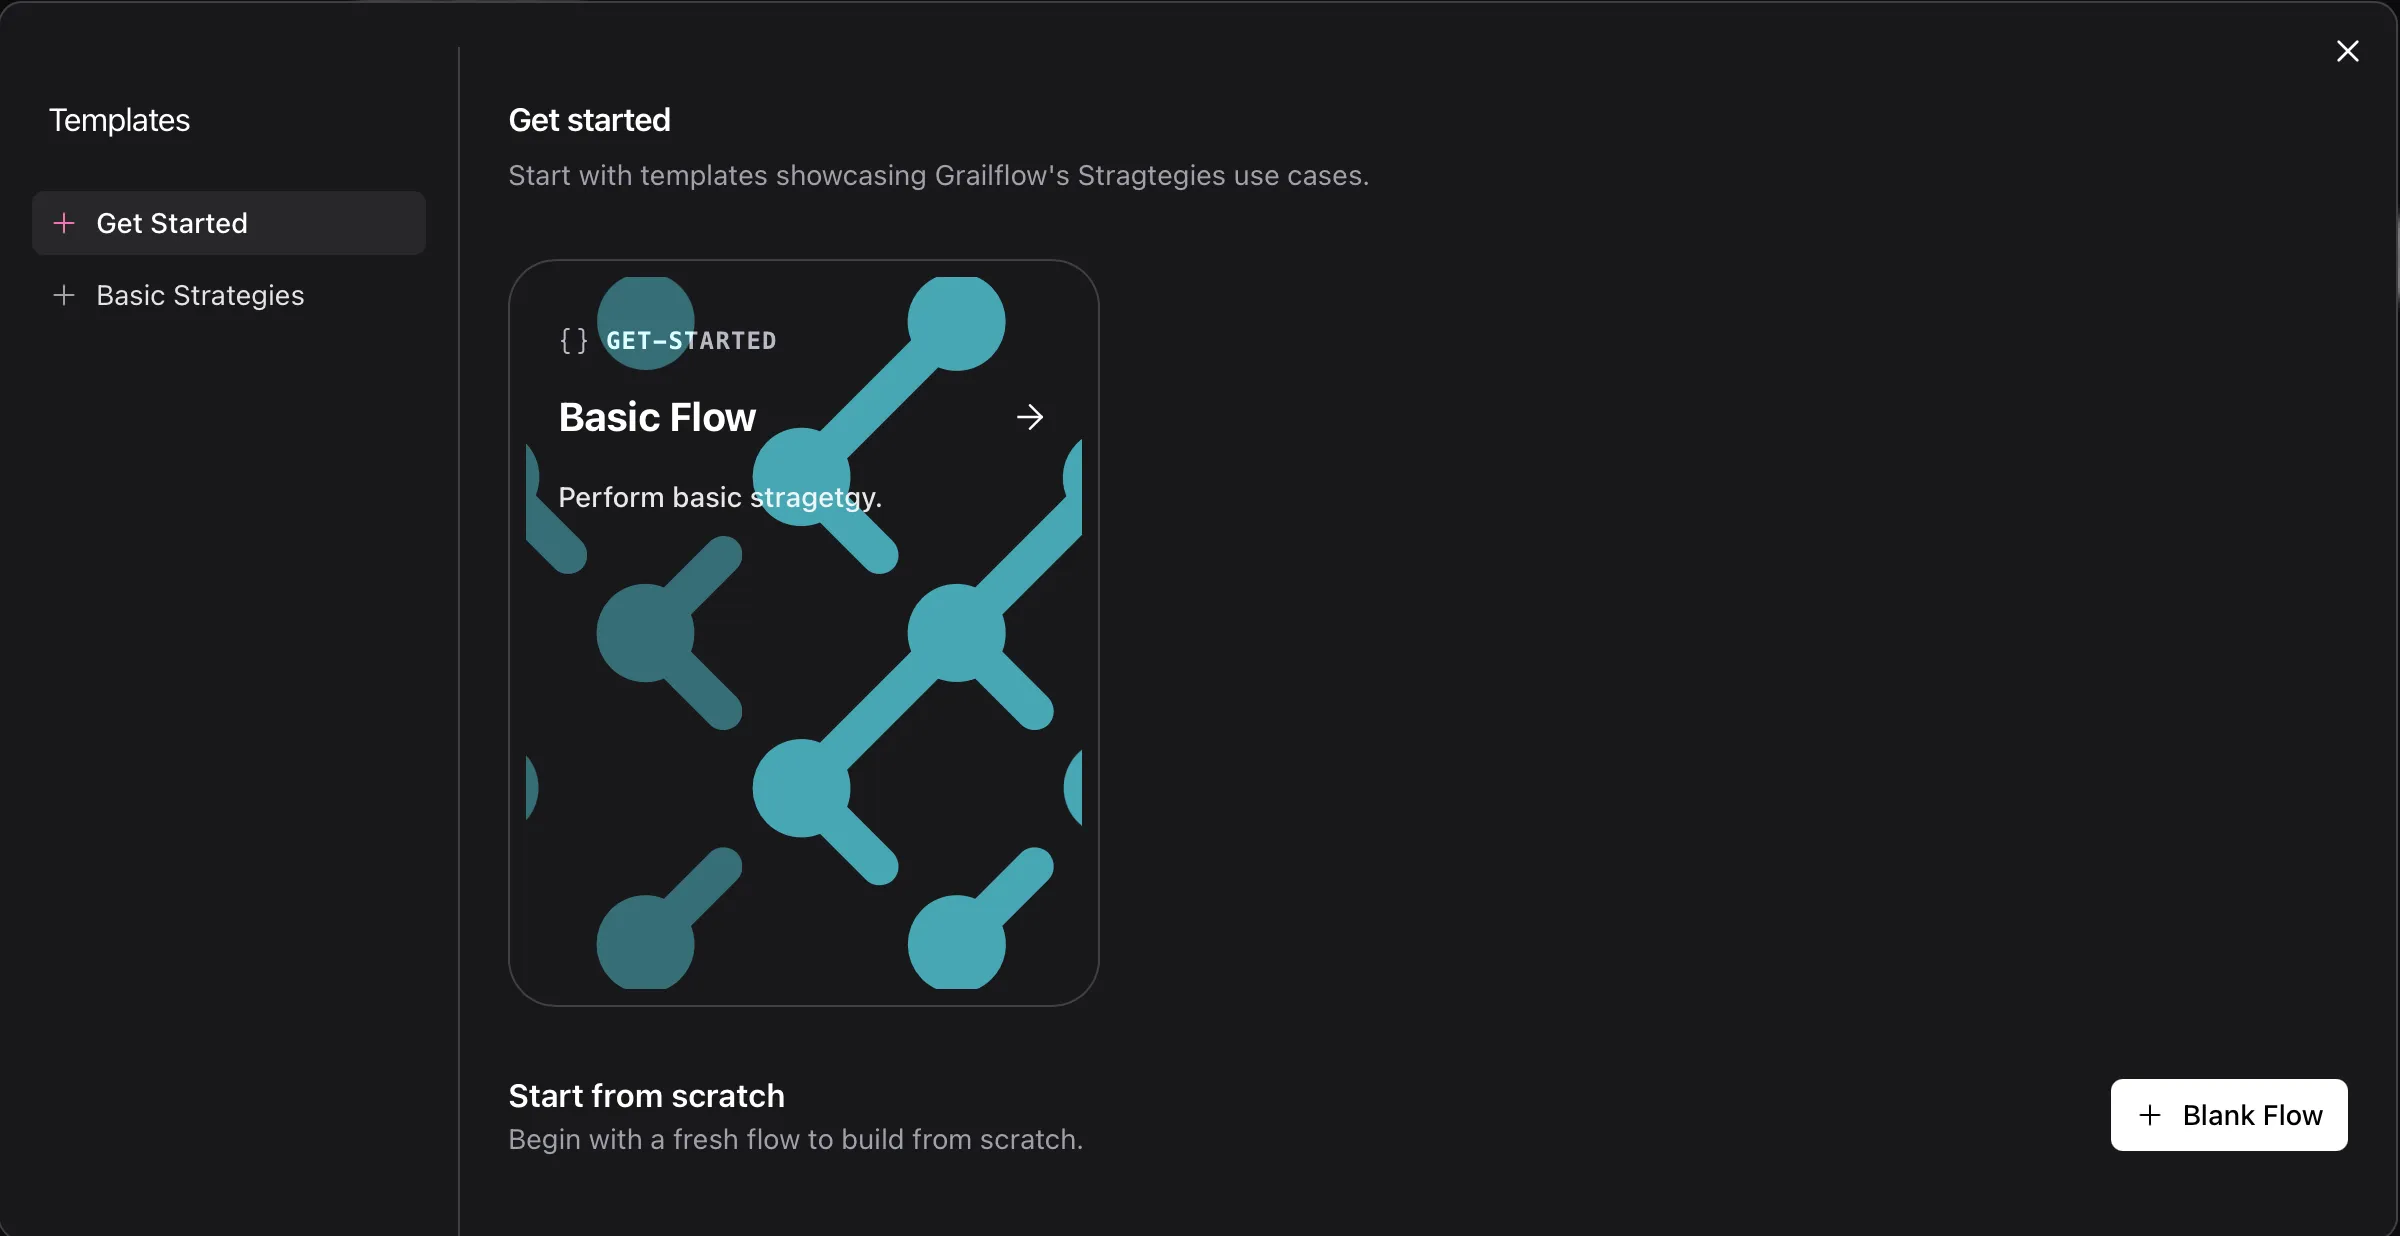
- Name it:
BTC Price Alert - Click “Create”
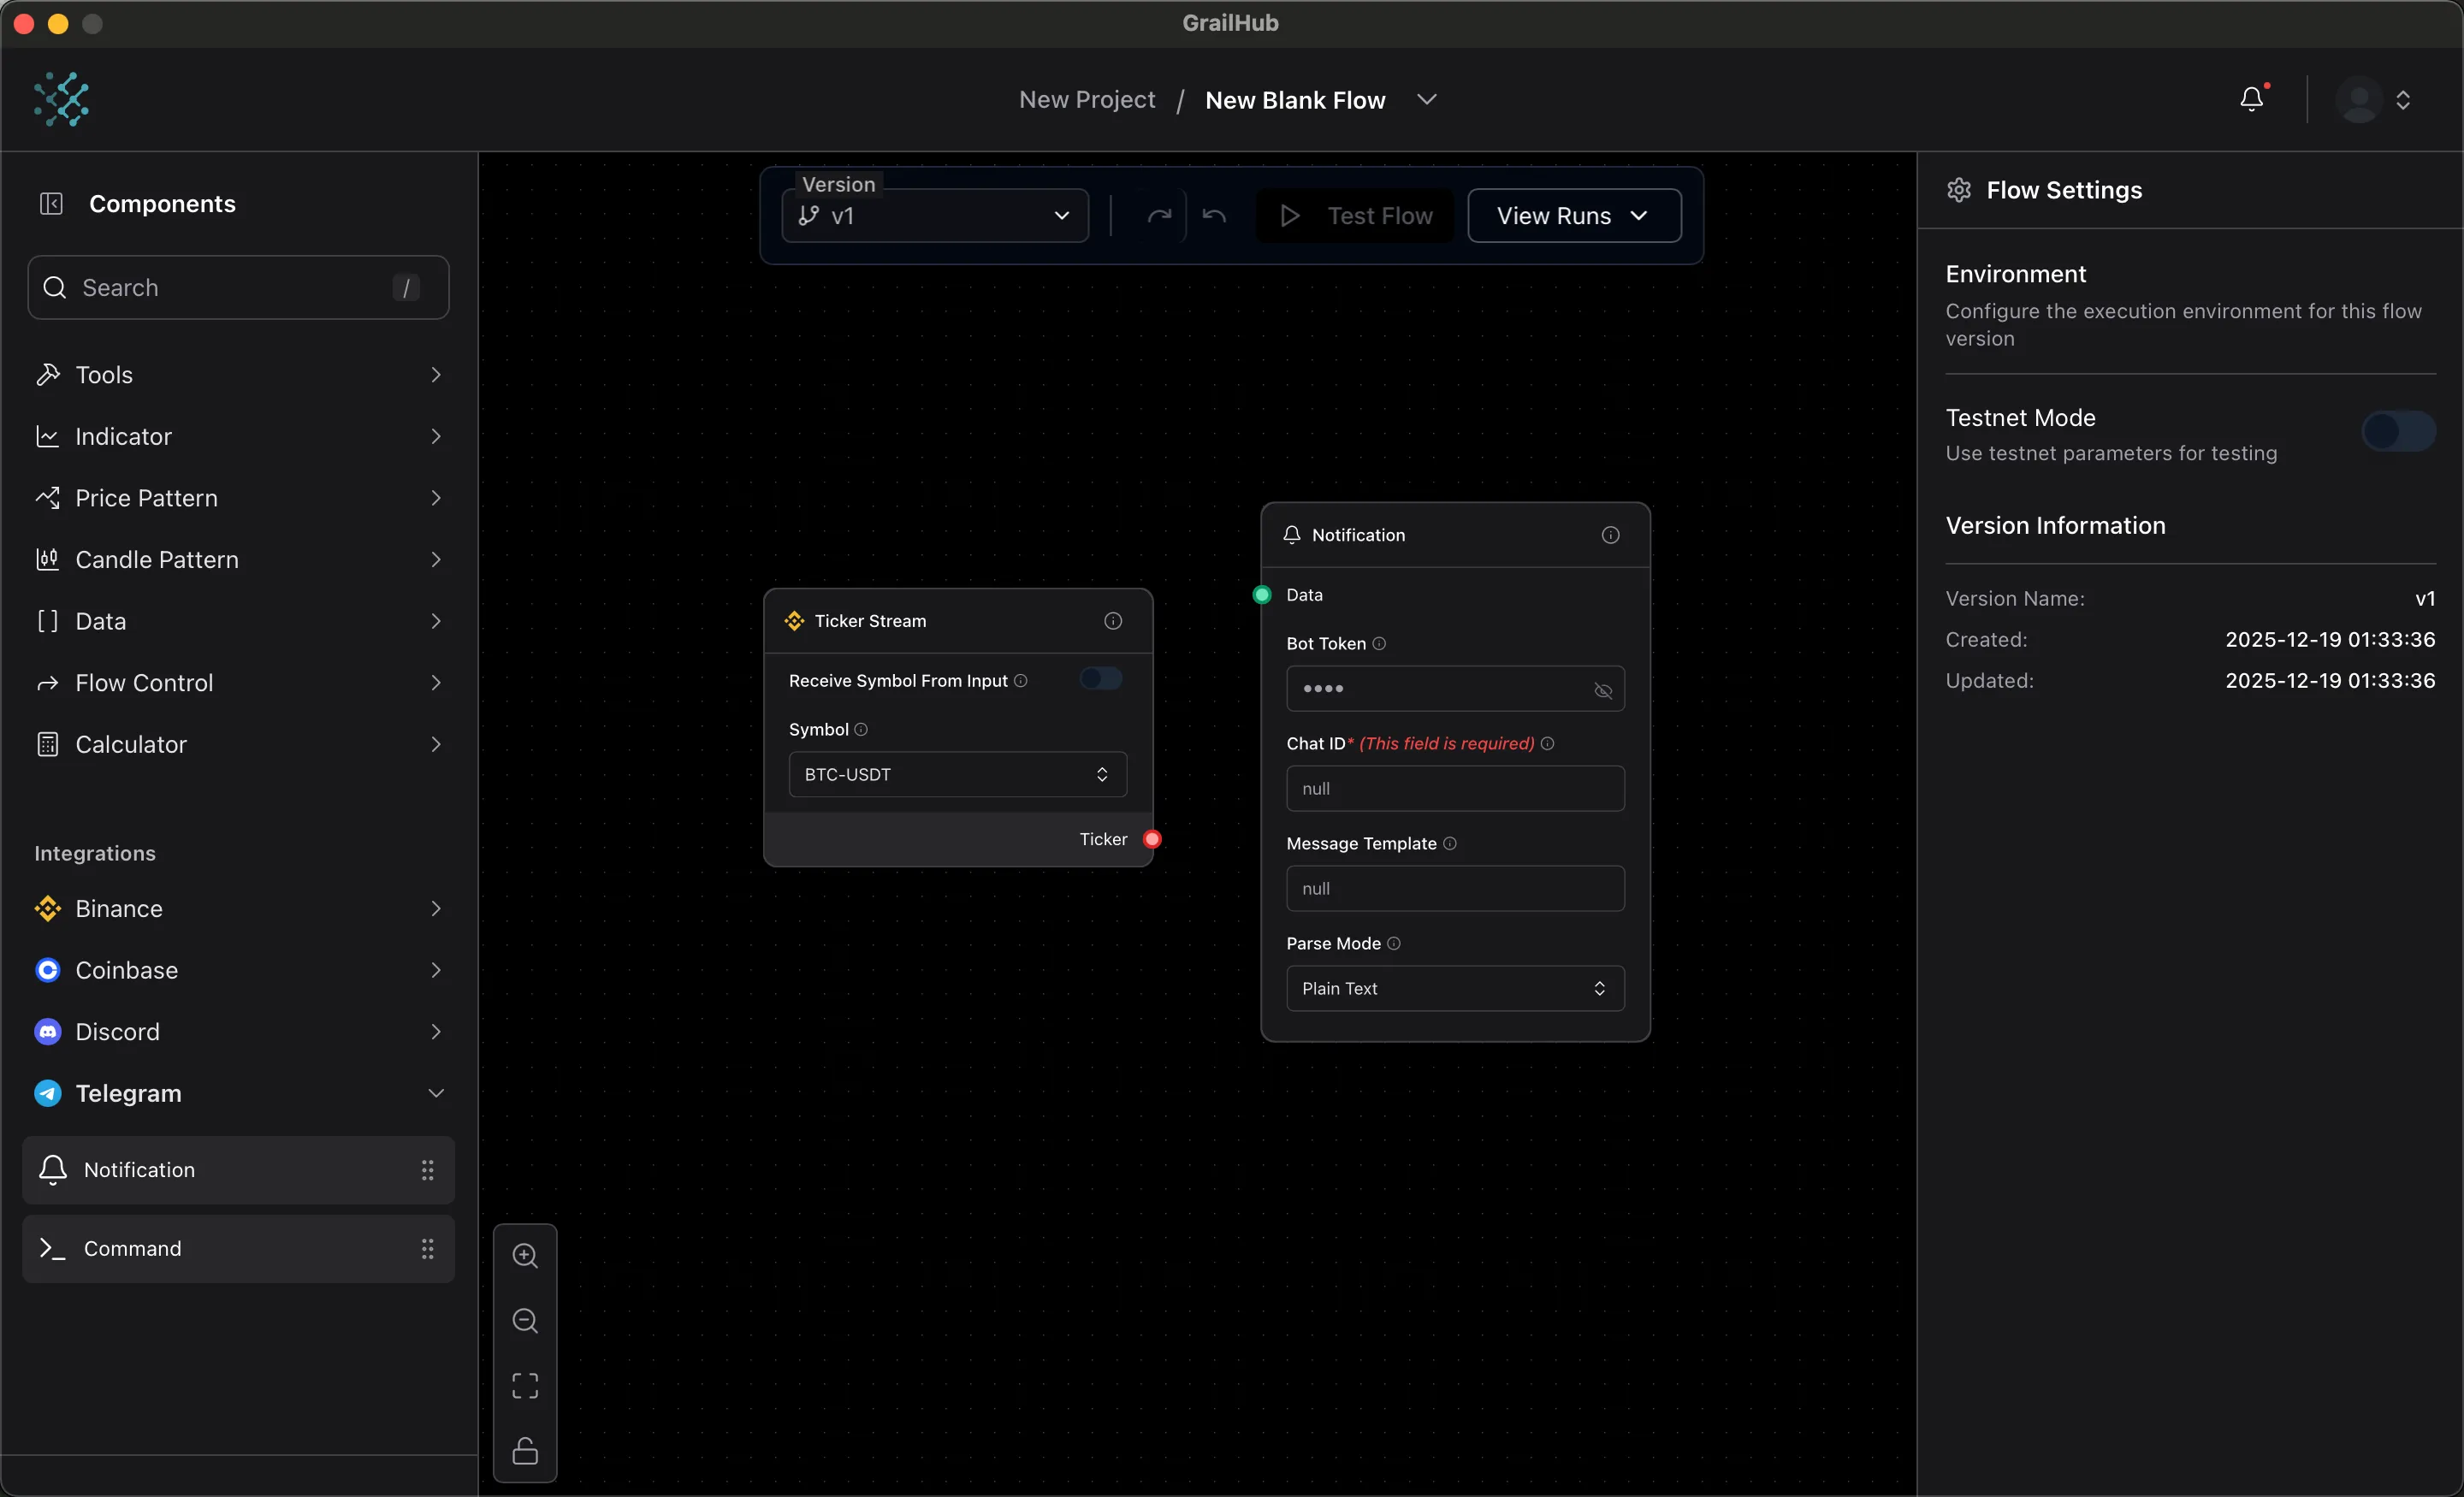
You’ll see the Flow Builder—a canvas where you’ll build your bot.
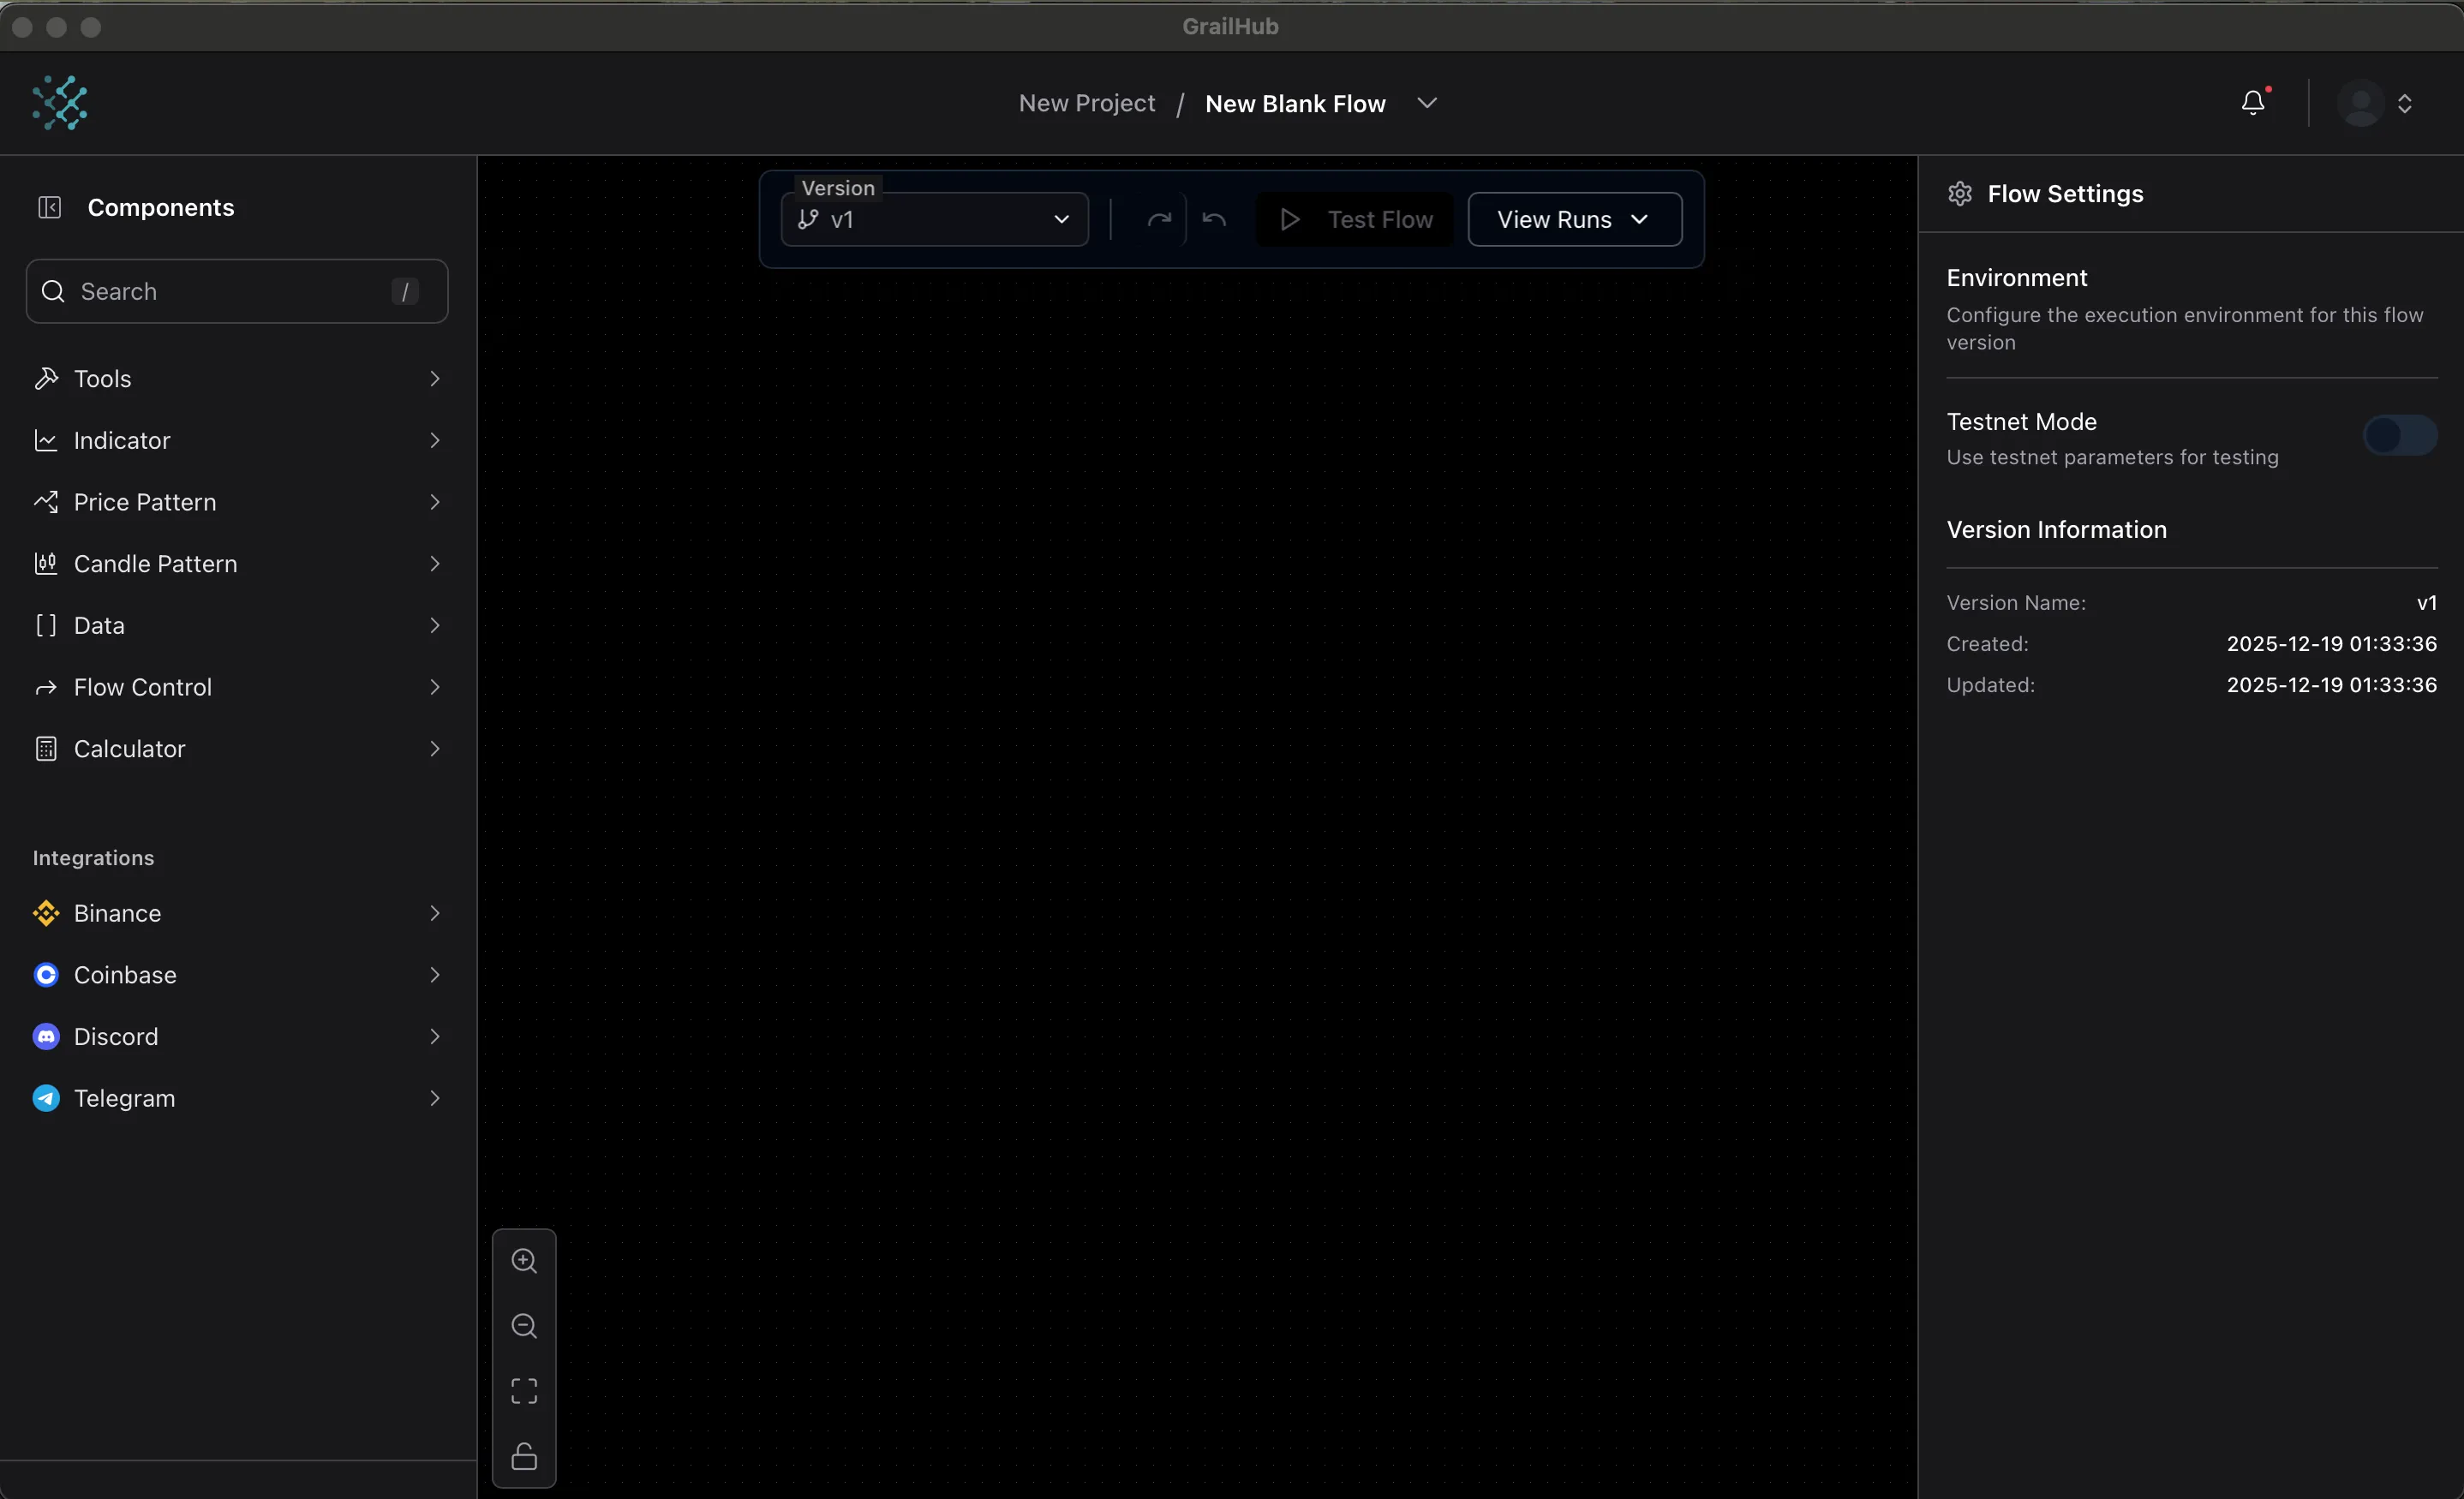
Step 2: Add Components
Section titled “Step 2: Add Components”Components are the building blocks. Let’s create a simple Bitcoin price alert.
Add a Ticker Component
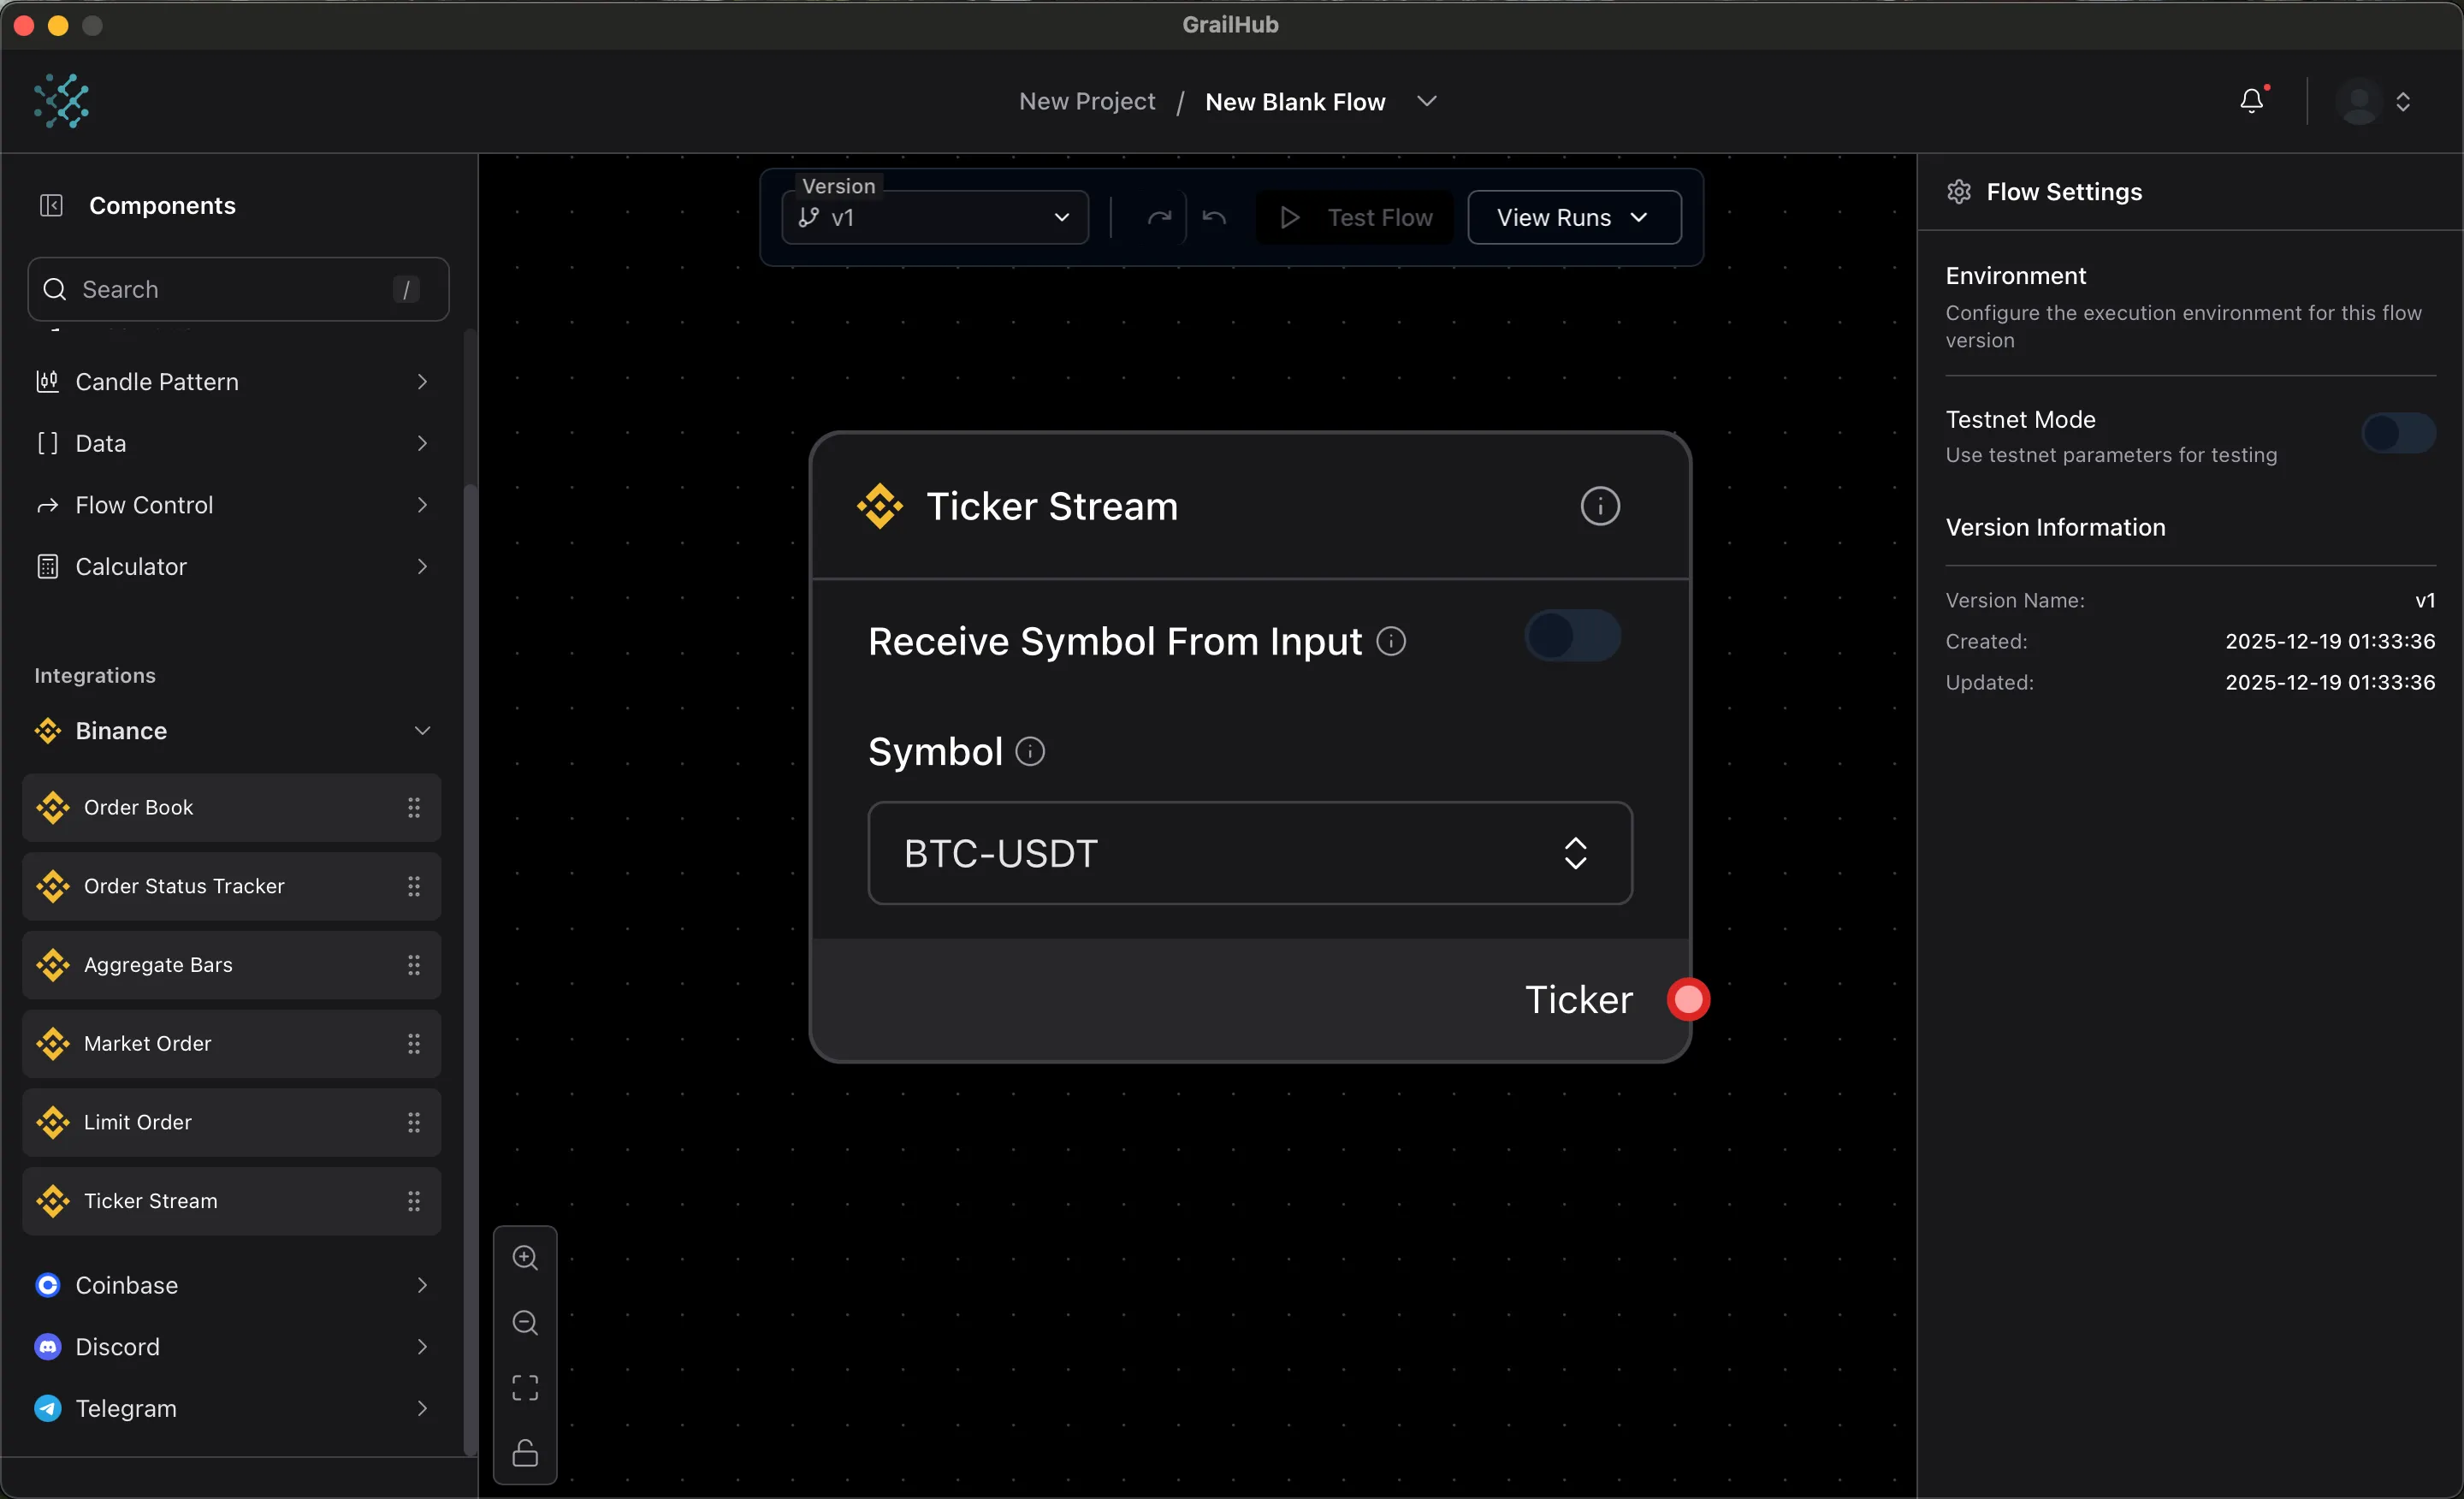
Section titled “Add a Ticker Component”This fetches the current Bitcoin price.
- Navigate to the Components tab.
- Search for “Ticker Stream”
- Click to add it to the flow or drag the component in
- Click the component to configure:
- Symbol:
BTCUSDT - Interval:
1s(updates every second)
- Symbol:
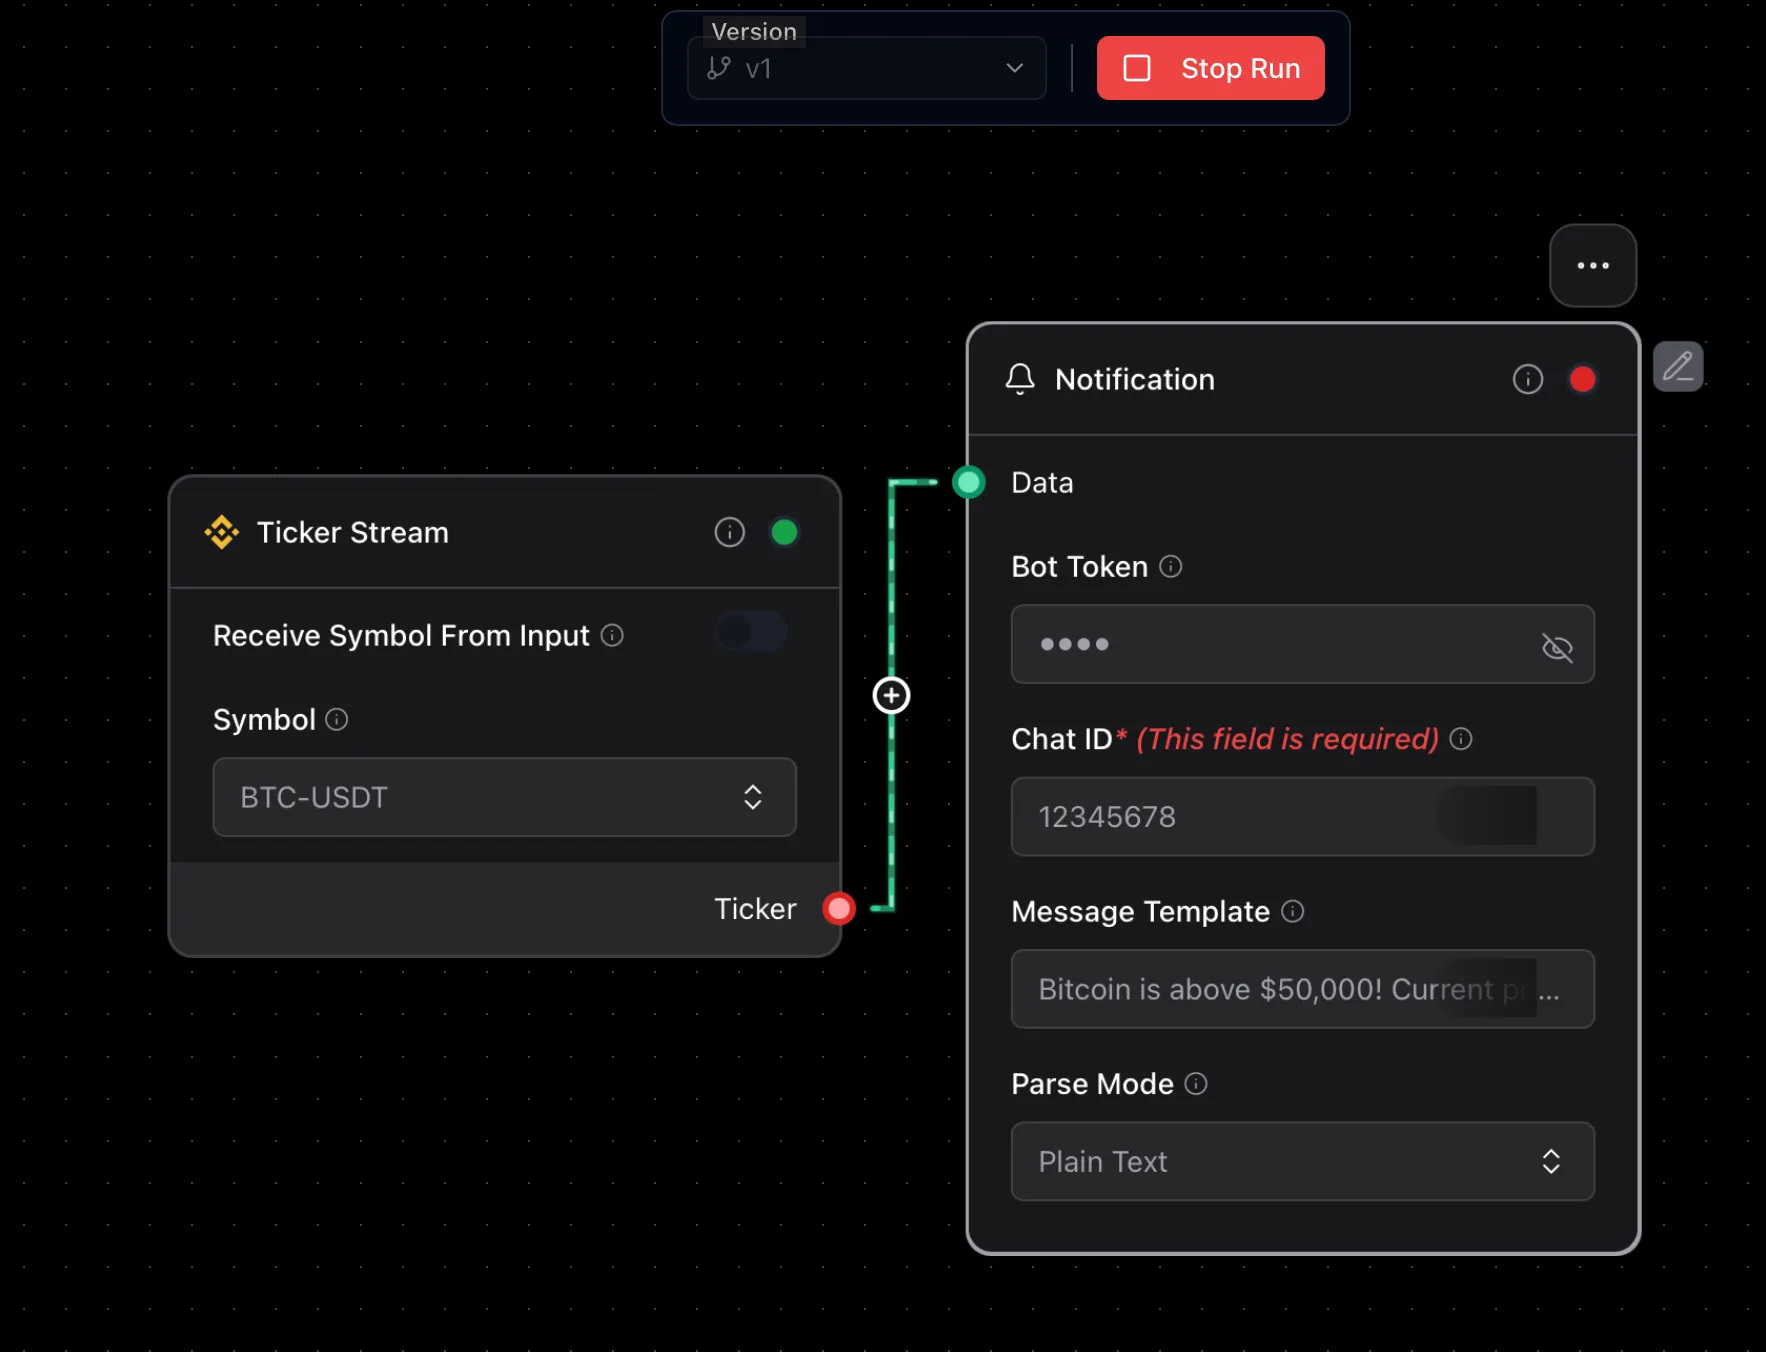
Add a Notification Component
Section titled “Add a Notification Component”This sends you an alert.
- Add component: “Telegram Notification”
- Configure it:
- Bot Token: Your Telegram bot token
- Chat ID: Your Telegram chat ID
- Message:
Bitcoin is above $50,000! Current price: {{value}}
Step 3: Connect Components
Section titled “Step 3: Connect Components”Edges (the lines) show where data flows between components.
- Click and drag from the Ticker output handle to the Condition input handle
- Click and drag from the Condition output to the Notification input
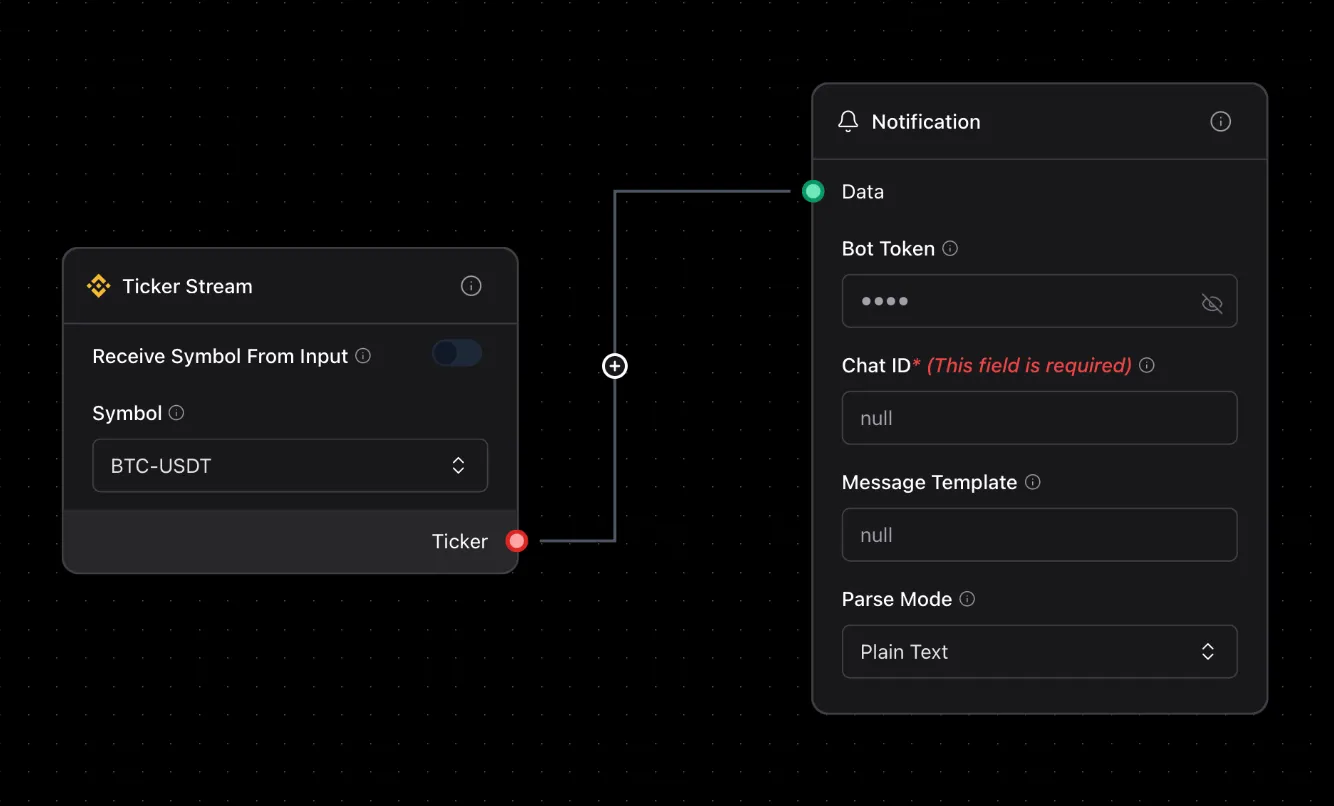
Then to config the condition click to the icon + in the edges to open filter value
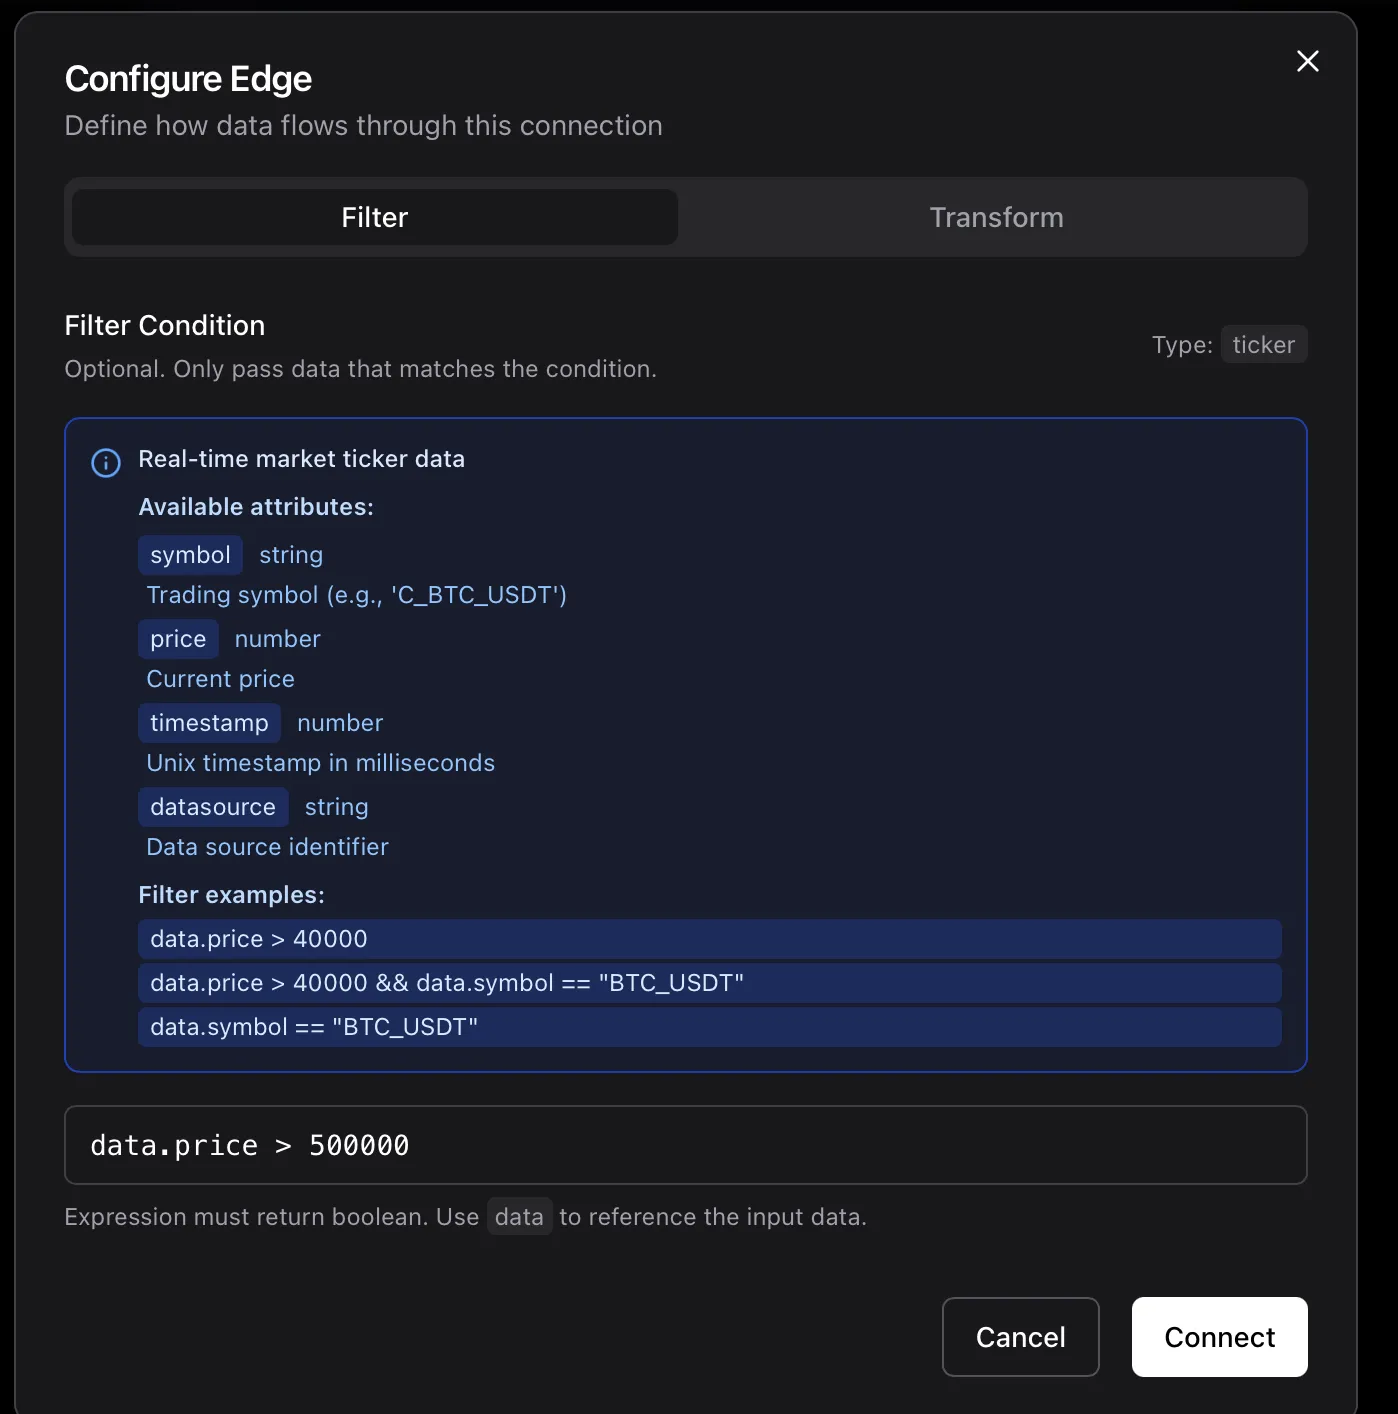
Your flow now:
- Gets Bitcoin price every second
- Checks if it’s above $500,000
- Sends you a Telegram alert when true
Step 4: Run Your Flow
Section titled “Step 4: Run Your Flow”Time to test it!
- Click the “Test Flow” button in the top
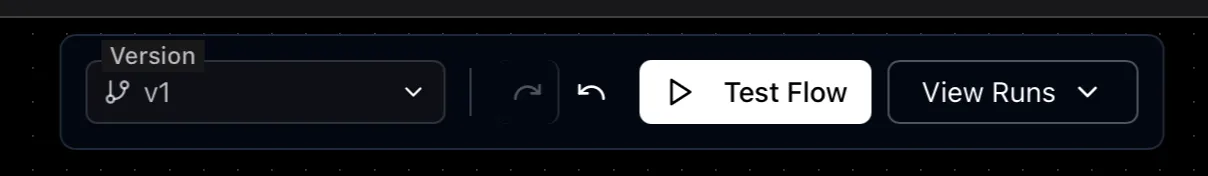
- Your flow starts executing
- Watch the status in node, if it’s green it means it’s running
What You’ll See
Section titled “What You’ll See”- Green indicators on components show they’re running
- Data flowing through edges (you’ll see values passing)
Stop the Flow
Section titled “Stop the Flow”Click the “Stop” button when you’re done testing.
Step 5: Schedule Your Flow (Optional)
Section titled “Step 5: Schedule Your Flow (Optional)”Instead of running manually, schedule your flow to run automatically.
- Click the “View Runs” Selection -> “Create New Schedule”
- Choose the time schedule
- Click “Start”
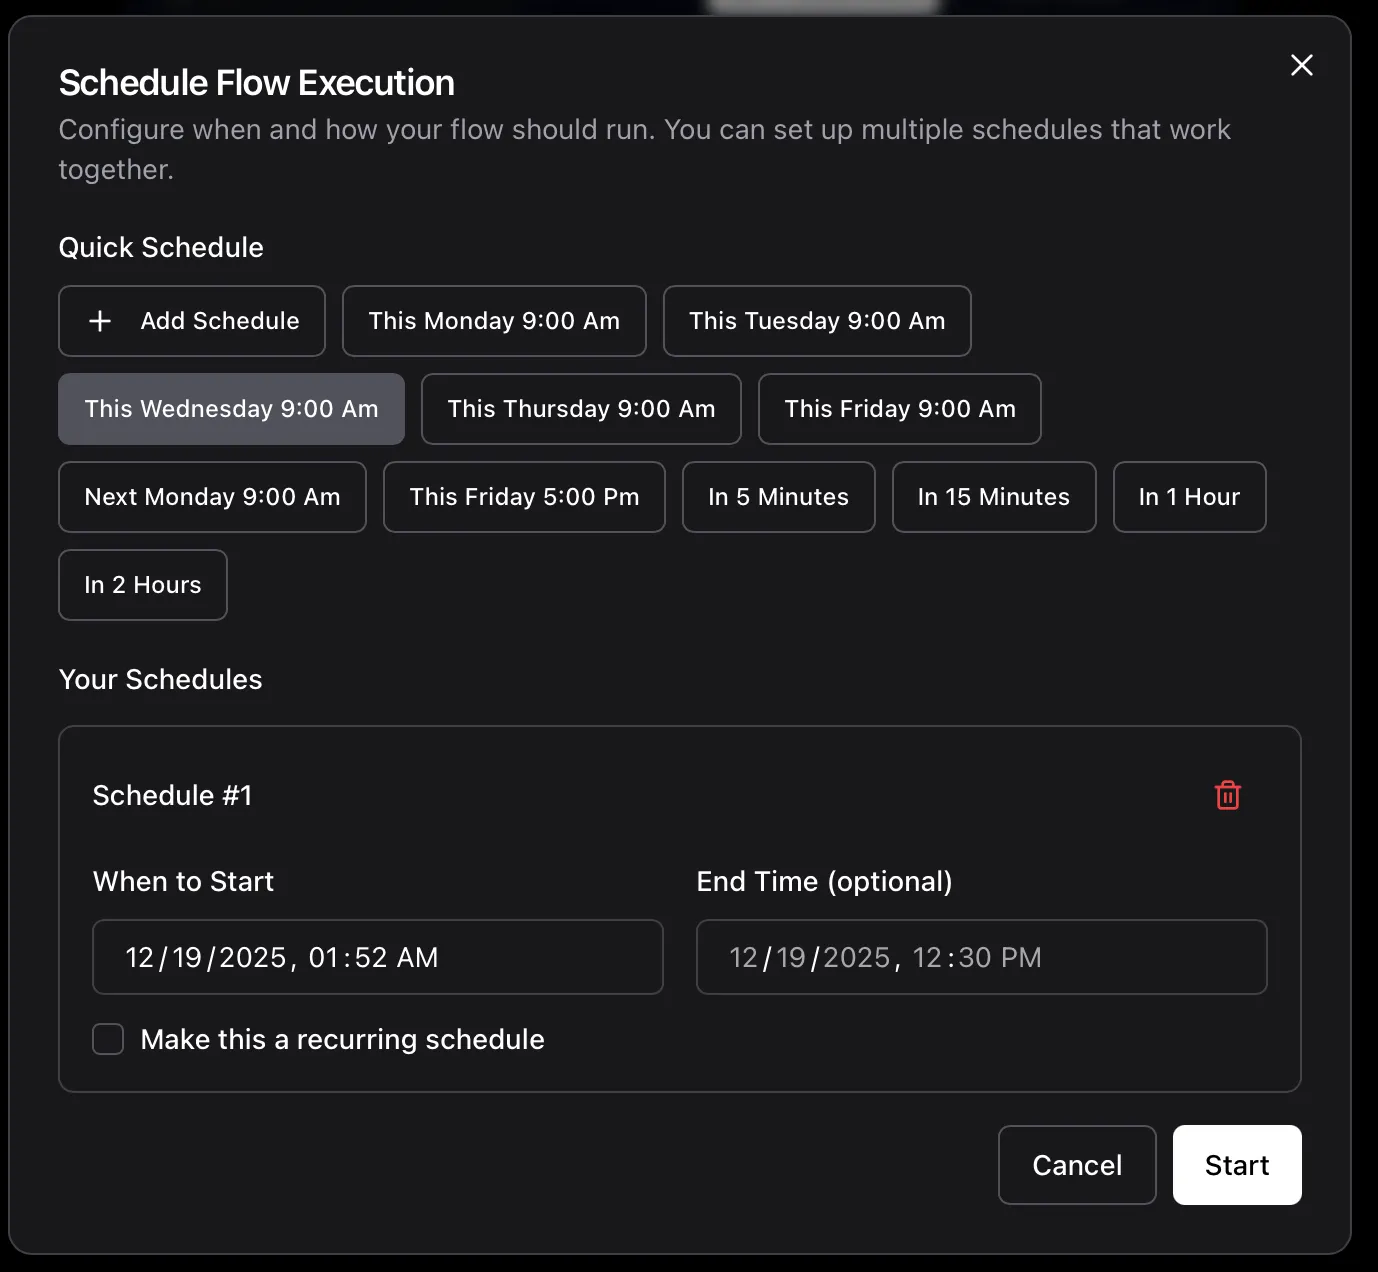
Your flow now runs automatically on your schedule!
Understanding What You Built
Section titled “Understanding What You Built”Let’s break down your first workflow:
Components
Section titled “Components”- Binance Ticker: Fetches real-time Bitcoin price from Binance
- Condition: Evaluates if price meets your criteria
- Telegram Notification: Sends you an alert
Data Flow
Section titled “Data Flow”flowchart LR
A[Binance Ticker] --> B[Condition]
B --> C[Telegram Notification]
Configuration
Section titled “Configuration”Each component has settings you can adjust:
- Inputs: What data it needs (e.g., ticker symbol)
- Outputs: What data it produces (e.g., current price)
- Config: Component-specific settings (e.g., update interval)
Next Steps
Section titled “Next Steps”Congratulations! You’ve built your first workflow.
Enhance Your Flow
Section titled “Enhance Your Flow”Try these improvements:
Add More Conditions
- Check multiple price levels
- Combine with volume indicators
- Add time-based filters
Add More Notifications
- Discord alerts
- Email notifications
Use Technical Indicators
- RSI (Relative Strength Index)
- MACD (Moving Average Convergence Divergence)
- Bollinger Bands
Build More Complex Strategies
Section titled “Build More Complex Strategies”Price Monitoring
- Track multiple cryptocurrencies
- Set up price range alerts
- Monitor percentage changes
Trading Automation
- Automated buy/sell orders
- Stop-loss management
- Portfolio rebalancing
Market Analysis
- Candlestick pattern detection
- Volume spike alerts
- Trend following strategies
Common Patterns
Section titled “Common Patterns”Multi-Asset Monitoring
Section titled “Multi-Asset Monitoring”Monitor multiple cryptocurrencies:
flowchart LR
    A[Ticker BTC] --> D[Condition]
    B[Ticker ETH] --> D
    C[Ticker SOL] --> D
    D --> E[Notification]
Conditional Trading
Section titled “Conditional Trading”Only trade when multiple conditions are met:
flowchart LR
    A[Price Check] --> D[AND Condition]
    B[Volume Check] --> D
    C[RSI Check] --> D
    D --> E[Place Order]
Alert Escalation
Section titled “Alert Escalation”Send different alerts based on severity:
flowchart LR
    A[Price Check] --> B[Condition > 50k]
    A --> C[Condition > 60k]
    A --> D[Condition > 70k]
    B --> E[Telegram]
    C --> F[Discord]
    D --> G[Email + SMS]
Learn More
Section titled “Learn More”Core Concepts
Section titled “Core Concepts”Advanced Topics
Section titled “Advanced Topics”Community
Section titled “Community”You’re ready to build! Start experimenting with different components and create your own trading strategies.